As organizations increasingly adopt microservices and serverless architectures, understanding and securing their environments becomes more complex. Teams need a way to connect the dots from when an application is launched to when it’s being attacked. A modern application observability technique called “tracing” is the key to surfacing these missing insights. Traditionally used for complex bottleneck optimizations, traces unlock a ton of security potential. At Miggo, we leverage telemetry to enhance application protection by monitoring anomalous behavioral interactions across distributed systems. By tracing requests, we’re enabling organizations to quickly identify the source of an attack, mitigate its impact, and enforce necessary measures to prevent additional impact. Incorporating a robust observability solution can remove the challenges found in distributed applications. In this article, you'll learn:
- What application traces are and how to use them
- How tracing can be used to investigate and detect attacks
- Why tracing enhances application security efforts
What is Tracing and How Does it Work?
Tracing is a technique used to monitor and record the sequence of events or operations within a system, helping developers understand how data flows and identify performance bottlenecks. Tracing extends this concept to modern distributed systems, where a single request might traverse multiple services, databases, and network components. Tracing enables two key pieces of information:
- The path a service request takes across a distributed system
- The time spent to complete each individual action and each service request
Tracing works by tagging each operation with a unique trace identifier to provide a detailed view of a request's entire journey, enabling easier debugging, root cause analysis, and performance optimization in complex architectures. In other words, it shows everything that really happens inside your application, from where the user input their data, to how it got to a response. Here's an illustration of how tracing works within a distributed system.
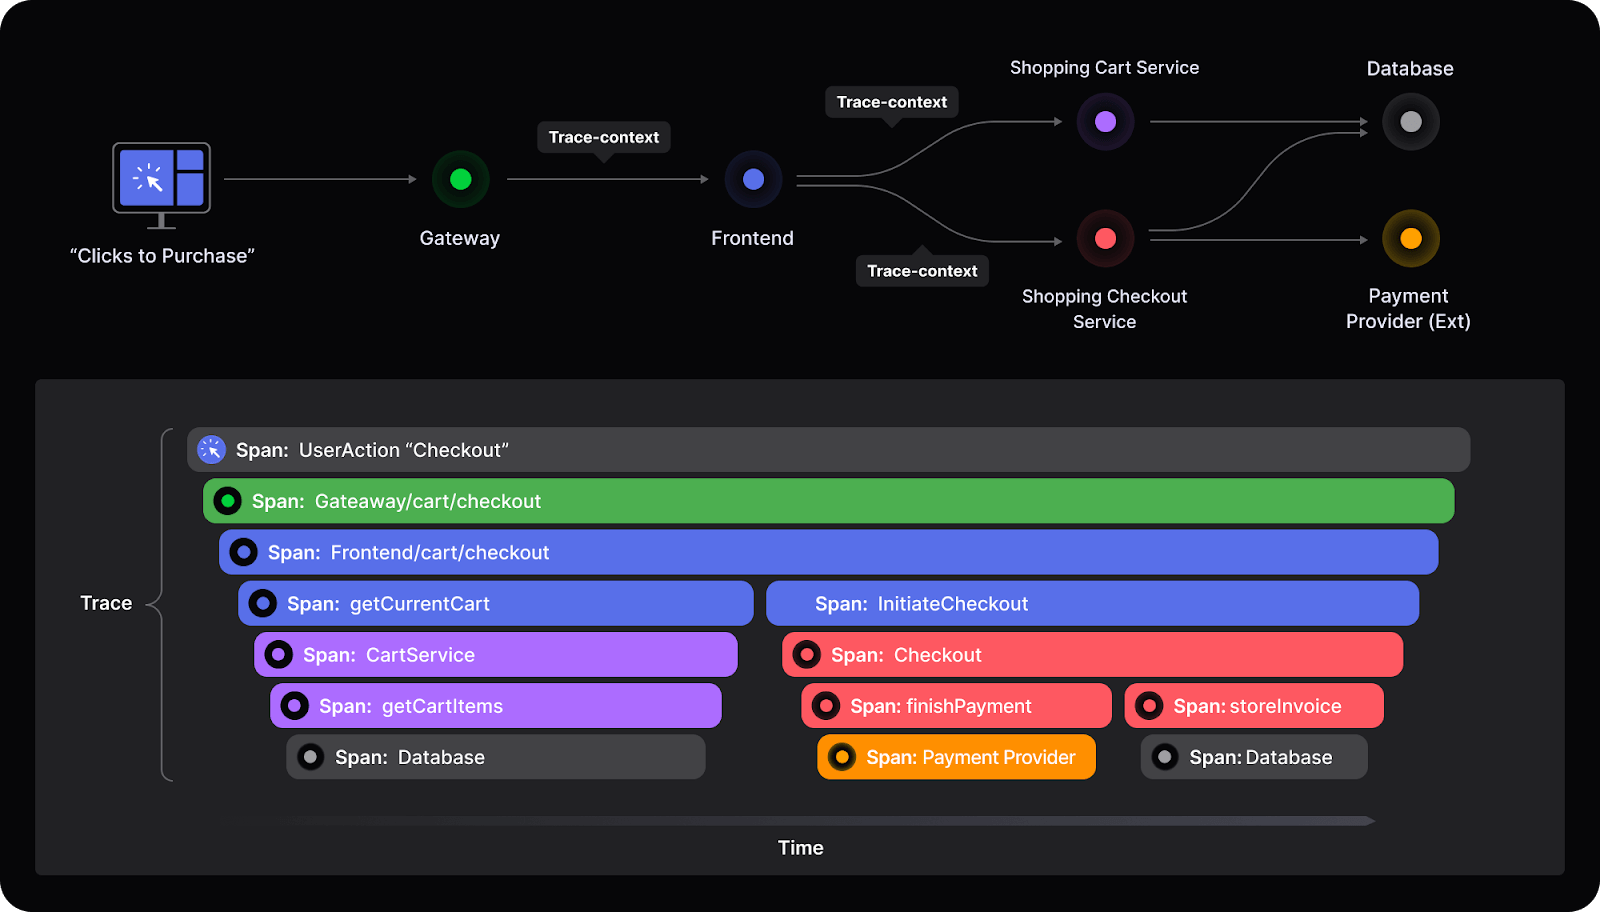
This diagram highlights two essential aspects of tracing: inter-service communication (distributed tracing) and spans. Traditionally, security teams have only been able to view issues on a service-by-service basis, which leaves them without the total context of an event. Spans are the individual events that happened during a user’s journey in your application and how they relate to each other - this shows the entire flow across an interaction.
The Benefits of Tracing in Security
Tracing is a powerful diagnostic tool for any environment, because you can investigate issues from a central place. It consolidates records of events that take place across components of a system, allowing you to connect events across the entire application and gain more behavioral contextual insights. This level of visibility and context brings many benefits. Here are the four most impactful ones:
- Enhanced visibility
- Efficient issue resolution
- Improved resource allocation
- Effective investigation and debugging
To better understand how traces can give you the information needed to build a response path during an unexpected event, let’s walk through two real-life examples.
Scenario #1: Identifying a Post-Exploitation Attack
What is post-exploitation?
Post-exploitation refers to the actions taken by an attacker after gaining unauthorized access to a system. During a successful exploitation, attackers will usually upload a web shell script directly that mimics a “new extension” of your web applications to avoid detection and bypass protective layers of tools like EDR. Web Shells are notoriously difficult to detect and commonly used to bypass traditional EDR tools. To hide their post-exploitation activity, there’s a growing trend to use in-memory techniques (e.g. MemShells) when possible.
What is the impact?
If the attacked application is business-critical, it can be exploited for data theft or to cause operational disruption. If it’s not, it can still serve as a foothold for lateral movement and establishing persistence within the network.
Let’s explore a real example of a post-exploitation attack.
Post-Exploitation Attack Scenario
Suppose an attacker uses compromised creds to gain access to your database and query sensitive customer data. Since your application also needs access to this data, no amount of preventative controls can stop this from taking place. To execute this plan, the attacker might take one of two different approaches. The first might be detected by an EDR, but the second requires tracing:
- Execute a new process: This is typically referred to as remote code execution, when attackers can start new processes or functions within your environment. This step is used to execute specific commands on the system. For example, they might run scripts to manipulate the environment, gather credentials, or access data. They might use this ability in order to create a tunnel to maintain access or bypass firewalls secretly. This gives the attacker a persistent network connection to your environment.
- Embed logic into a Web Shell to achieve:
- Tunneling to the database: The Web Shell acts as a relay to route traffic from the attacker to the database server.
- Leveraging common ORM libraries: Tools like sqlalchemy or pymongo enable programmatic interactions with the database, allowing the attacker to exfiltrate or access data efficiently.
How would tracing be used to help?
In this attack scenario tracing would show your team:
- Where the request originated
- The API endpoint(s) that were queried - no matter how many intermediate steps were between the attacker and the specific service
- The exact request that propagated to a database service, triggering a series of read operations
- The sudden spike in egress traffic
- Detection of the post-exploitation technique, even if it was a webshell
At Miggo, we’ve combined the visibility of traces with the power of threat and anomaly detection in order to stop the most advanced attacks. In an attack like this, tracing would allow us to fully investigate everything involved in the attack - from the point of entry through to the exploit itself, and what data was taken. It enables context like:
- A list of every new endpoint that was accessed for the first time in a specific location
- The number of accesses to a specific endpoint
- Which endpoints accessed our database
- What actions were taken once the attacker got in
- Exactly what processes and application manipulations the attacker may have taken
- Any signs of an attacker foothold or lateral movement
Now, let’s look at our second example of investigating security events using tracing, this time with a simple TraceQL query.
Attack #2: HTTP Request Smuggling
What is Request Smuggling?
Request smuggling allows attackers to interfere in how servers handle HTTP requests. These attacks rely on tricking HTTP servers to interpret packets in an order that it was not designed to, such as appending data to the beginning of another user’s request. Request smuggling vulnerabilities are typically prioritized as critical, because they allow attackers to bypass security controls and gain unauthorized access to sensitive information.
What is the impact?
Request Smuggling is a critical vulnerability that has been used to breach high-profile services, exploit cloud applications, and compromise API infrastructures resulting in:
- Bypassing Security Controls (e.g. WAFs)
- Exploitation of Internal Services
- Session Hijacking
- Cross-Site Scripting (XSS)
- Chaining with Other Attacks (SQL injection)
Request Smuggling Attack Scenario
Let’s look at a real example where our vulnerable application is made of two components: NGINX as the front-end web server and a Python back-end server running Wekzeug (a common web gateway) version 3.

In this example, the Python web application (Flask and Werkzeug) has two endpoints configured by the NGINX gateway: /admin, which can run code on the system, and /* for all non-admin endpoints. NGINX configuration forwards incoming requests to the Python server while blocking direct access to the /admin endpoint.
The Impact
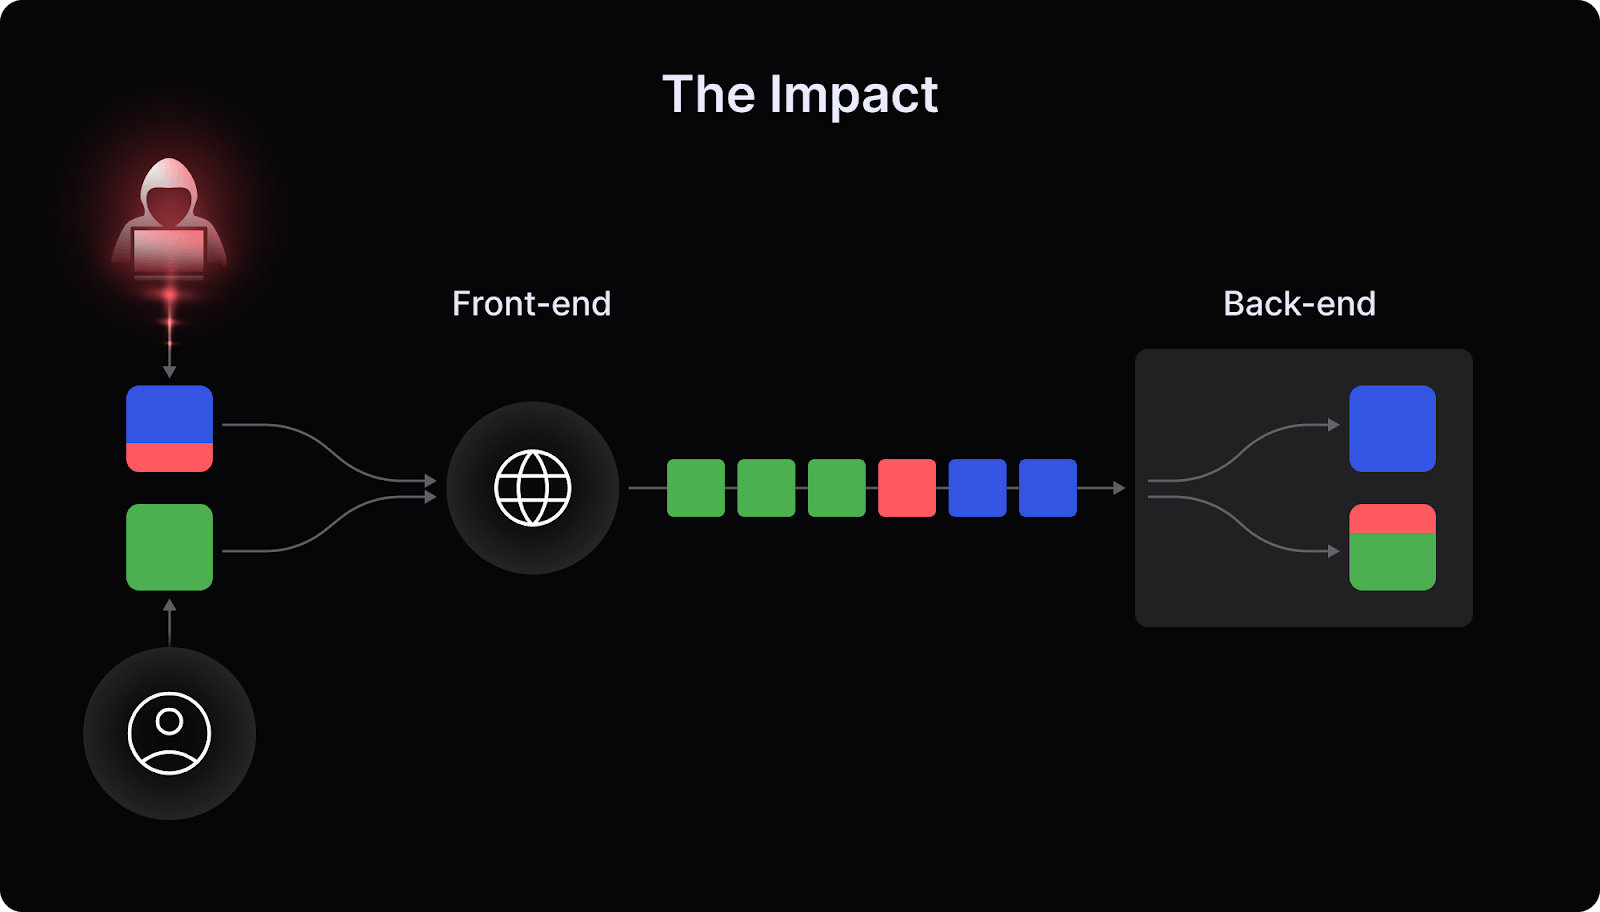
In this example, we’ll exploit a vulnerability in Werkzeug library, running in the /setname endpoint, in order to smuggle a request to the admin endpoint, which NGINX is supposed to be blocking.
If our Python server defines an endpoint called /setname:
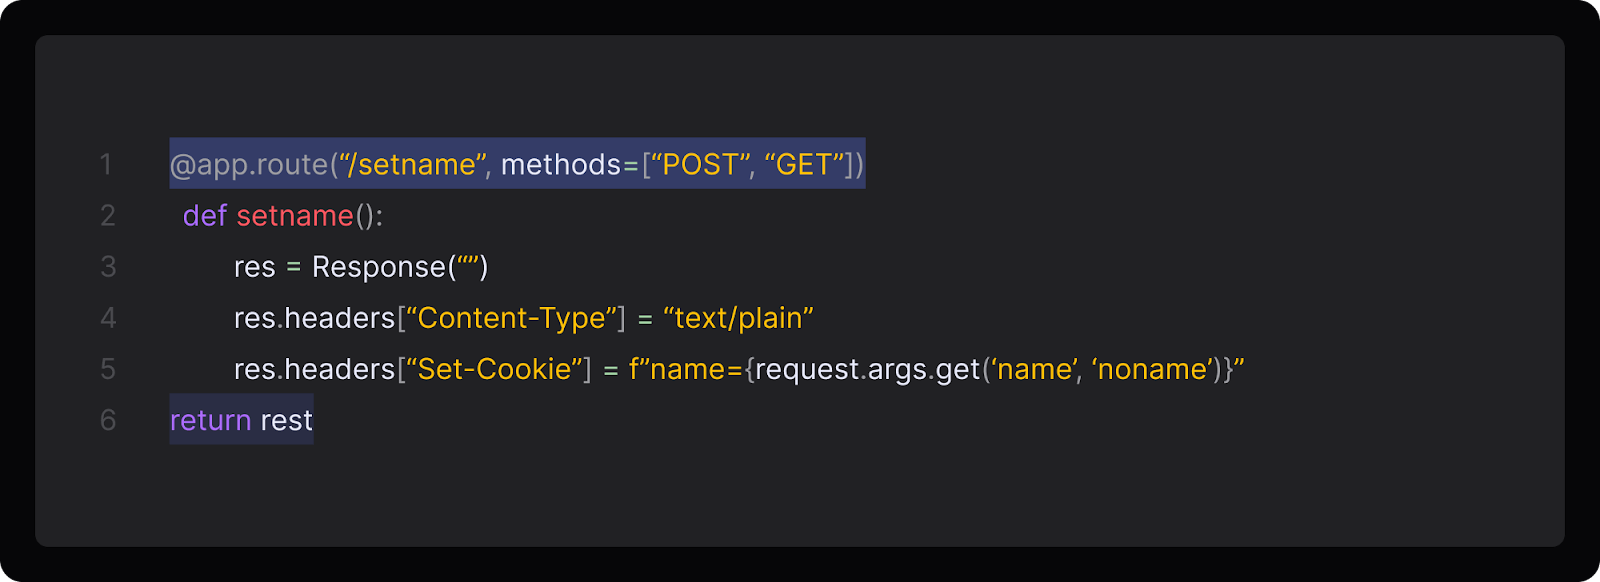
An attacker will be able to exploit this endpoint by sending a request like this one:

Sending a get request to /setname that bypasses the interpretation logic:
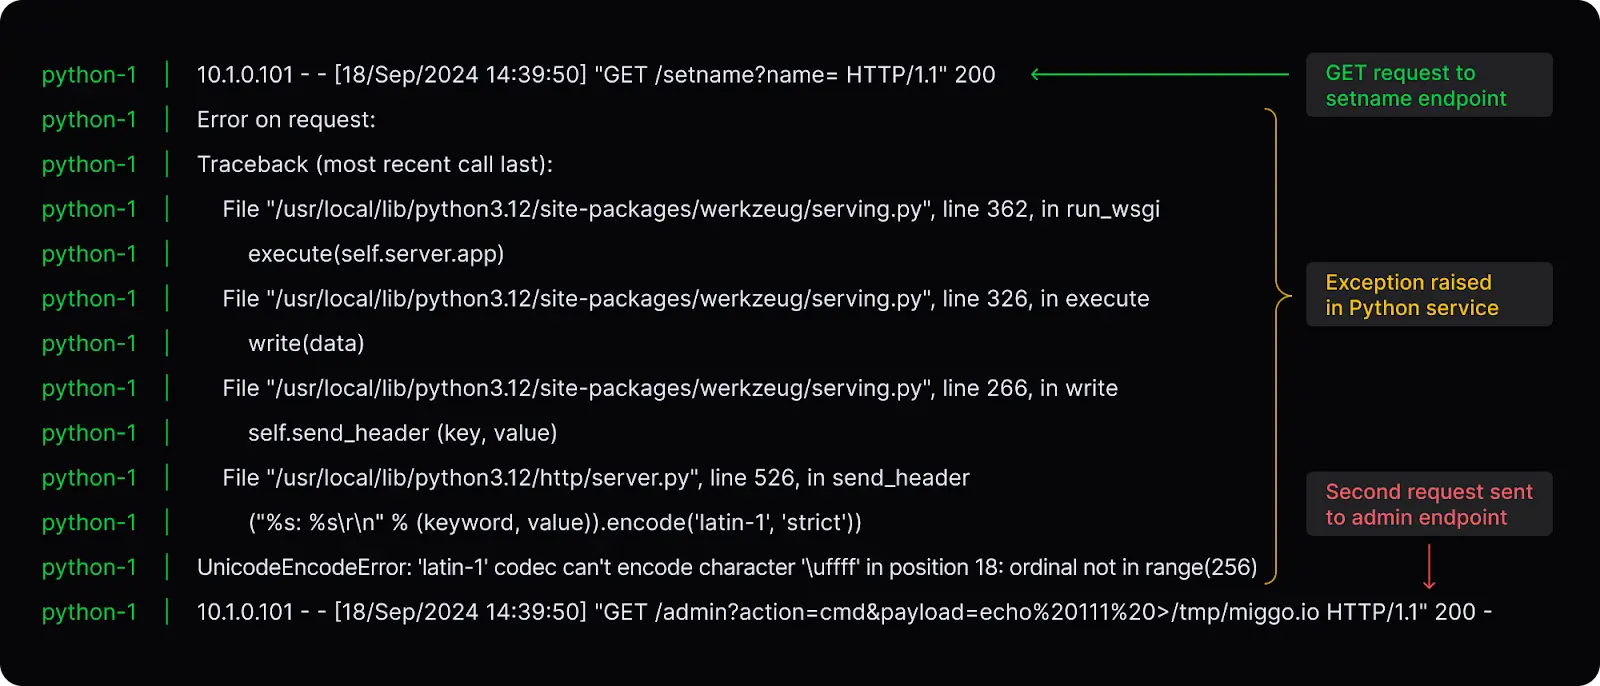
This request gets interpreted as:
- The NGINX server will read it as one request and pass it along with the request body.
- Instead of reading one request as intended, the Python server will instead successfully read two requests.
- The first request will trigger an exception, and the request body will be ignored, but the socket between the Python server and NGINX will remain open.
- The Python server successfully reads the second request and dispatches it to the
/adminendpoint, which NGINX should be blocking
Therefore, an attacker can send one request to the /setname endpoint and smuggle a second request to the sensitive /admin endpoint.
How would Traces help?
The important note is that this attack bypassed the NGINX load balancer entirely. Other network tools might tell you that a blocked endpoint, like /admin, was reached through the load balancer by the internet. However, only tracing can show us that the traffic came from the /setname endpoint, and not from the load balancer. On top of just tracing, only Miggo’s anomaly detection can raise the alert that these services don’t normally communicate, and that an anomaly has been detected to a sensitive endpoint.

Technical consideration: Notice that the NGINX traces just the first request and treats “the second request” as the body of the first. If we look closely, we can see one normal trace containing the two services (NGINX and Werkzeug) and one trace without the NGINX service. In other words, we have a span going directly to the admin endpoint, appearing to bypass the NGINX service.
Tracing provides the context of how HTTP requests are processed, helping teams detect, investigate, and respond to HTTP Request Smuggling incidents effectively. This is also an example of why we built anomaly detection as part of the Miggo engine - sometimes the lack of a particular span can indicate an attack, rather than its presence.
Wrapping Up
When defending your web application from breaches, telemetry is your best asset and it’s crucial to know how to leverage the different types of telemetry, especially if that telemetry can help with solving another problem. Many security teams struggle to get these deeper layers of application insights, as they require upstream dependencies on manual logging efforts from developers. At Miggo, we’re enabling teams with the tools to stop the most advanced attacks.


.webp)